A Beginner's Guide to Candlestick Patterns
for trading stocks for monthly income, as a part-time or full-time job
Candlestick Charts are one of several different types of stock charts that traders and investors may choose to use. Candlestick Charts are the most popular because this type of chart shows the most information and is the easiest to learn for most new or beginning traders.
How to Read Candlestick Patterns
Green and Red Candlesticks are often used on black backgrounds but White and Black Candlesticks on a white background are the ideal way to study stock charts since this is the easiest format for the human eye and brain to interpret. This is how we learned to read, so it makes for a more natural transition to reading candlestick patterns.
On Daily Charts, where each candlestick represents the movement of a stock’s price during one day of trading activity, white (or green) candlesticks represent a day when the price closed above the day’s opening price. The black (or red) candle represents the price closing below the day’s opening price
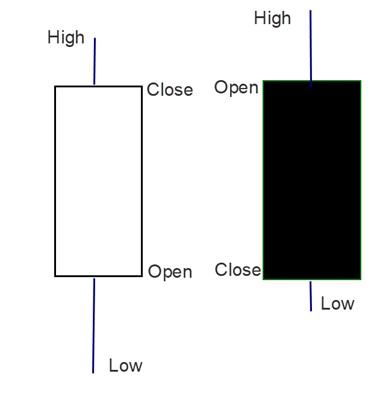
Wicks and tails define the high and low, respectively, for that day, regardless of the color of the body of the candlestick.
For a White Candle, the Open is the horizontal line at the bottom of the candlestick; the Close is the top horizontal line. The high of the day’s trading activity is at the top of the wick, which forms above the Close line. The Tail is the vertical line below the Open line.
For Black Candlesticks, the open and close are opposite of a white candle. The opening price is the top of the black candle; the closing price is the bottom of the candle. The high and low are the same as the white candle: at the top, the wick represents the high price of the day and at the bottom, the tail is the low price of the day.
Below is a stock chart with white and black candlesticks. Each candle represents one day of trading activity. The green and red bars below the candlesticks are the Volume Indicator. The Chart is laid out according to a Golden Rectangle Aspect Ratio, which is ideal for visual analysis and developing excellent Spatial Pattern Recognition Skills (SPRS). This is a critical skill to learn and use to select the best stocks to trade.
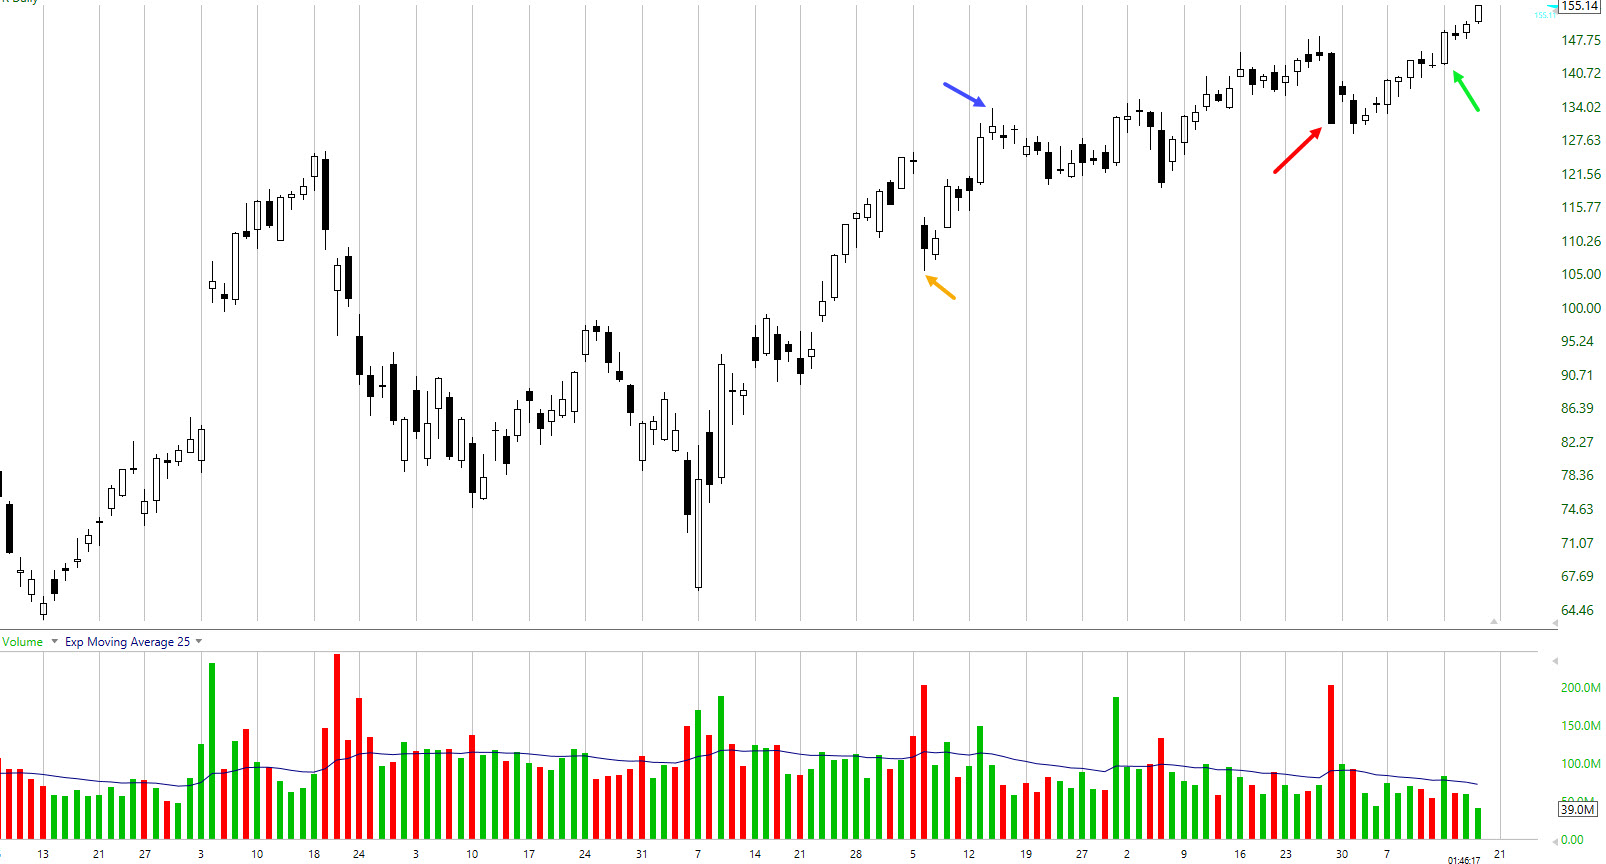
Notice that the size of the candlesticks is constantly changing. Some are very long while others do not even have a full candle body--this indicates very small price fluctuation. This is where you need to learn how to read Candlestick Charts.
Think of it this way:
If you have a musical background, what you are looking at is the sheet music of the market. The stock market has musical themes. Lots of black candles are drums and deep low tones. White candles moving up are soaring notes.
IF you have a programming background: instead of 1s and 0s you are reading white candles and black candles. Just as programming language is one that requires training to see the patterns, so is the LANGUAGE of the stock market.
For those of you who are engineers, think of the charts as the blueprints of the internal market structure.
For business owners, think in terms of your business growth, sales and marketing, as this is exactly what the charts and candlesticks represent. When the candlesticks are moving in an uptrend, then revenues are improving. When the candlesticks are moving down, revenues or earnings are declining.
So, looking at this chart, from April to current, is the stock moving up? Yes. The candlesticks have both up and down days, but the overall trend is up.
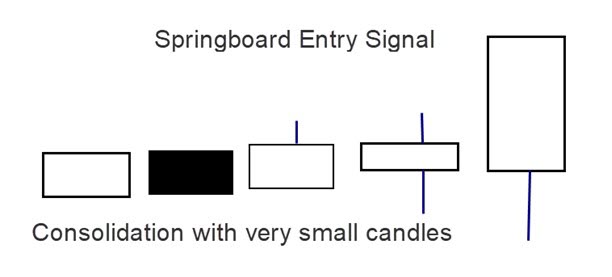
The Stair Step Entry Signal is one of the stock signals you'll start learning about in the Leading Candlestick Patterns mini course. This candlestick pattern is created by professional traders who are setting up the stock to move to the upside. The candlesticks form a tight Consolidation, which is a series of very small candles all in a row that makes the “step”, and the signal to buy the stock is the Springboard candlestick pattern where price moves up.
History of Candlestick Charting
Candlestick Charts were invented by the Japanese in the 16th century for their rice commodity market, which was also a currency market as rice was used to pay taxes. Candlestick Charts were introduced to the western world by Steve Nison, CMT in the late 1990s. His book became required reading for the Chartered Market Technician Program administered by the CMT Association, which is a global credentialing body for technical analysis.
However, the Rice Commodity market of ancient Japan is totally different from the U.S. Stock Market of today, which has evolved into a mostly digital commerce. This has changed the frequency and efficacy of some of the candlestick patterns.
Plus, commodities trade differently than stocks do. Commodities are traded with futures contracts, which obligate the buyer to pay for and take possession of the commodity and the seller to produce and deliver the commodity to the buyer at an agreed-upon price, within a certain timeframe. Stocks are an asset since buying shares of stock is investing in a company and they can be held for as long as the company remains listed on the stock market. Stocks allow anyone the opportunity to make money from the vast wealth of the U.S. stock market and its numerous publicly traded companies.
Since the Japanese have a great love of art, their Candlestick Patterns have exotic names:
Doji, Morning Star, Evening Star, Three Soldiers, Three Mountains, Dark Cloud, etc. So trying to learn all these candlestick patterns can be confusing and frustrating as the terms do not reflect what each candle pattern actually represents or how price will move in the next few days.
Also, the Stock Market of the US has undergone massive internal changes in the past few years. Candlestick patterns, Candlestick Entry Signals and Exit Signals are different. WHY?
Because there are 12 Market Participant Groups now, and each has their own “footprint” or candlestick pattern which that market participant creates when buying or selling a stock. So, the original candlestick patterns from Japan often do not work or indicate properly. Plus, the exotic names are hard to remember because the names are unrelated to the direction the stock price may take in the next few days.
Fortunately, TechniTrader teaches a set of simple, easy-to-understand buy signals for trading stocks.
Learn more about Candlestick Charts, Candlestick Patterns and TechniTrader’s Buy Entry signals for trading stocks in the Leading Candlestick Patterns mini course.

